Assess Total Risk
Use the Exposure Management dashboard to understand the risk in your cloud and on-premises environments.
What is the Exposure Management dashboard?
The Exposure Management dashboard provides security leaders with a unified view of their vulnerability risk across cloud and on-premises (on-prem) environments. By combining data from Cloud Security (InsightCloudSec) CloudVM and Vulnerability Management (InsightVM), leaders can understand remediation progress and make decisions to drive their security programs.
This dashboard provides the following sections to help you understand the risk data from your environments:
- Key Performance Indicators help you understand your risk posture at a glance by displaying the latest metric, how it has changed over time, and link to details.
- Risk overview tracks vulnerability risk trends across cloud and on-prem environments.
- Remediation progress provides data to evaluate the efficiency and effectiveness of your remediation activities at reducing vulnerability risk.
- Environment trends displays data for changes in your cloud and on-prem environments that impact the vulnerability risk score.
- Accepted risk monitors how much on-prem risk has been accepted through vulnerability exceptions.
- Accountability identifies potential gaps in ownership of assets to drive remediation.
How is risk calculated?
The Command Platform uses a normalized risk score to make it easier to consume and communicate risk to your stakeholders. Normalized risk scoring aggregates the total risk of all vulnerabilities and assessed assets within the scope defined by the filters, taking into account the following vulnerability and asset attributes, and normalizes to a range of 0 to 1000.
 Vulnerability Attributes
| Attribute | Description |
|---|---|
| CVSS Score |
The Common Vulnerability Scoring System (CVSS) standard assesses individual vulnerabilities on a scale of 0.0 to 10.0 using a variety of metrics. By default, the Command Platform uses v3 scores where available, otherwise v2 scores are used instead. For zero day scenarios where a CVSS score has not yet been assigned but exploitation in the wild has been observed, the CVSS score is not considered. |
| Exploitability |
If an exploit or exploit kit exists for a vulnerability. Sources: and ExploitDB. “Exploitation” is a cybersecurity term for the ability to leverage an attack on a vulnerability by hackers. Read our blog for more information. |
| Exploited in the Wild |
If a vulnerability has been actively targeted by attackers in the real world. Sources: Rapid7 Research, CISA KEV, and third-party feeds. “Exploited in the wild” is a cybersecurity term for malware that attackers are actively using. This malware can be found on devices belonging to ordinary users. |
| AttackerKB | An expert assessment for how valuable a vulnerability is to an attacker and how easily exploitable is a vulnerability in real environments. |
| Exceptions |
If a vulnerability exception has been applied in Vulnerability Management (InsightVM). An exception is accepted risk for a vulnerability. |
Asset Attributes
| Attributes | Description |
|---|---|
| Criticality | Whether an asset has been tagged with a criticality tag in Vulnerability Management (InsightVM). |
| Accessibility | Whether an asset is determined to be publicly accessible in Cloud Security (InsightCloudSec). |
| Attack surface | Number of assets and potential attack paths within the scope. |
| Vulnerability reoccurrence | The diminishing effect of multiple instances of the same vulnerability found on an asset. |
Displaying data in Exposure Management dashboard
The Exposure Management dashboard is available from the Command Platform navigation menu. To display and view data in the Exposure Management dashboard, connect Cloud Security (InsightCloudSec) and Vulnerability Management (InsightVM) to the same Command Platform org and verify that you have assigned the correct access permissions. To get meaningful insight into your environment, you can refine the view using filters.
Connect data
For data to display in the Exposure Management dashboard, Cloud Security (InsightCloudSec) CloudVM or Vulnerability Management (InsightVM) must be set up and connected to the Command Platform. Depending on your product setup, the following data displays:
- If Cloud Security (InsightCloudSec) CloudVM and Vulnerability Management (InsightVM) have not been set up, you are prompted to set up the missing data source.
- If one of the products has been set up, the Exposure Management dashboard will load with the available data, and you are prompted to set up the missing product.
- When both products have been set up, you will have a complete view of vulnerability risk across your cloud and on-prem environments.
Verify permissions
Specific permissions are required for Command Platform, Cloud Security (InsightCloudSec), and Vulnerability Management (InsightVM) to view the Exposure Management dashboard. To view the Exposure Management dashboard and both cloud and on-prem data, ensure you have the following permissions:
| Solution | Required |
|---|---|
| Command Platform | Administrator (Shared) |
| Vulnerability Management (InsightVM) | Global Administrator |
| Cloud Security (InsightCloudSec) | One of the following roles assigned:
|
Refine the view
To refine the Exposure Management dashboard, expand the Filter section, adjust the drop-down menus as necessary, and then click Apply. The Cloud and On-Prem filters apply only to the cloud or on-prem data and cards, respectively.
Resource type filter data
Use the On-Prem Resource Type filter to view on-prem asset data from InsightVM. Use the Cloud Resource Type filter to view cloud asset data from Vulnerability Management (InsightVM) and Cloud Security (InsightCloudSec).
Reports
You can create reports from the Exposure Management dashboard, with all filters that are applied on the Exposure Management dashboard returned in the report.
Create a report
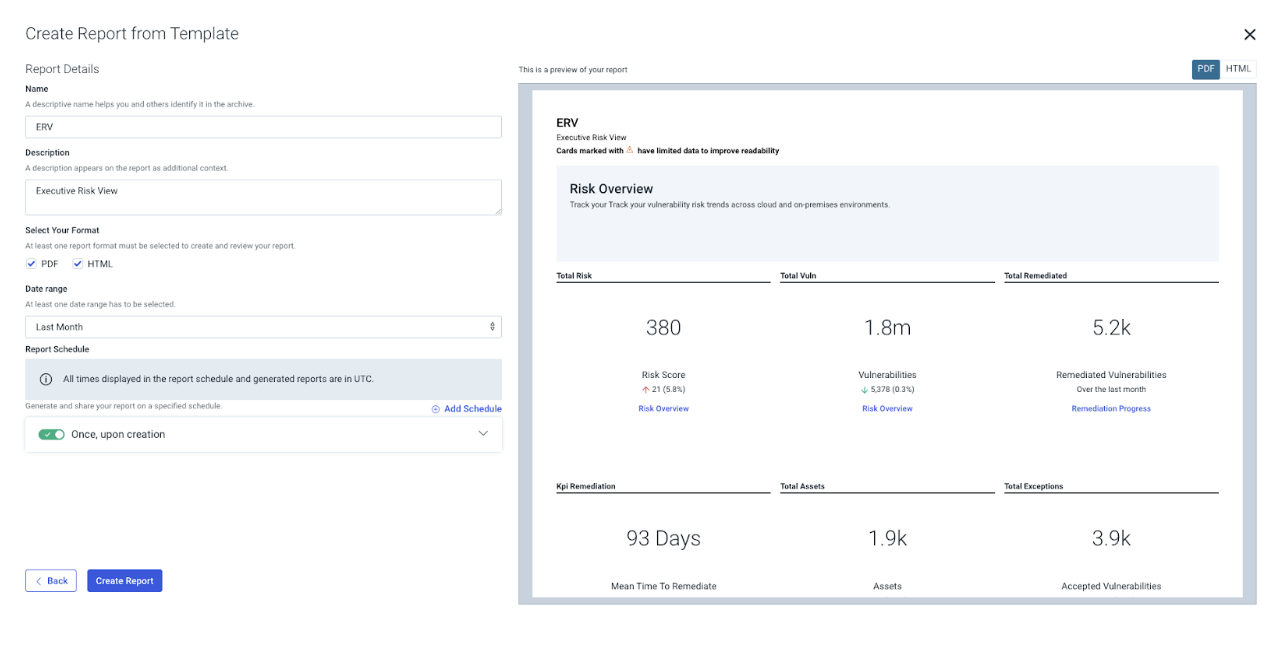
- Click Reports > Create Report.
- Select Exposure Management dashboard as the report template.
- Provide a name, a description, and select at least one format: PDF and HTML are allowed.
- Set the date range for the report.
- You can create a report once, or you can click + Add Schedule to set up a recurring schedule:
- Specify a frequency (in days, weeks, or months).
- Provide a date range for the report.
- Specify the users or email addresses that you want to share the reports with.
- Click Add Schedule.
- Click Create Report.
Name and description.
We recommend using a name and description that reflect the filters applied
View reports
After creating a report, you can view it by clicking Reporting > View Reports. This will take you to the Reports listing page. You can also go directly to Reports from the Command Platform navigation menu.
From the Reports page, you can easily search for reports by report date or date generated, sort reports, manage tags and add favorites, and select different ways to filter. Filtering options include:
- Favorite
- Tag
- Owned by me
- Owner (this allows you to filter by other Command Platform users who own reports)
You can also view reports (HTML report format) or download them (PDF format).
Understanding risk
Use the Exposure widgets on the Command Platform to help you understand the risk across your environment. This allows you to take a data-driven approach to decision making, capacity planning, and driving accountability for risk reduction across the business.
Summary KPIs
The Summary KPIs help you understand your risk posture at a glance. You can see the latest metric, how it has changed over time, and a link that will take you to the section in Exposure Management where you will find visualizations providing further details about the data supporting that metric.
Detailed description of Summary KPI dashboard cards
| Dashboard widget | Description |
|---|---|
| Total Risk Score | Total risk score across cloud and on-premises environments. The range for vulnerability risk scores is 0 - 1000. |
| Total Vulnerabilities | All unique vulnerability findings per asset across cloud and on-premises assets. |
| Remediated Vulnerabilities | The total number of remediated vulnerabilities across cloud and on-premises. Arrows indicate change in remediation progress. |
| Mean Time to Remediate | The mean time to remediation in days. This is the average time from first finding the vulnerability to remediation. |
| Total Assets | The total number of cloud and on-prem assets that were assessed for vulnerabilities. The arrow indicates the percentage of change in the number of assets over the past month. |
| Total Accepted Vulnerabilities | The number of all vulnerabilities with accepted risk. The arrow indicates the change in the percentage of accepted vulnerabilities compared to the number of all vulnerabilities. |
| Tagged Assets | The percentage of assessed assets that have at least one tag applied. The arrow indicates the change in the percent of tagged assets compared to all assets. |
| Dashboard widget | Description |
|---|---|
| Total Risk Score | Total risk score across cloud and on-premises environments. The range for vulnerability risk scores is 0 - 1000. |
| Total Vulnerabilities | All unique vulnerability findings per asset across cloud and on-premises assets. |
| Remediated Vulnerabilities | The total number of remediated vulnerabilities across cloud and on-premises. Arrows indicate change in remediation progress. |
| Mean Time to Remediate | The mean time to remediation in days. This is the average time from first finding the vulnerability to remediation. |
| Total Assets | The total number of cloud and on-prem assets that were assessed for vulnerabilities. The arrow indicates the percentage of change in the number of assets over the past month. |
| Total Accepted Vulnerabilities | The number of all vulnerabilities with accepted risk. The arrow indicates the change in the percentage of accepted vulnerabilities compared to the number of all vulnerabilities. |
| Tagged Assets | The percentage of assessed assets that have at least one tag applied. The arrow indicates the change in the percent of tagged assets compared to all assets. |
Risk Overview
By understanding trends in your risk across cloud and on-prem environments related to the number and severity of vulnerabilities, you can provide meaningful risk data to stakeholders. This data may also help identify potential changes needed to your security program to lower the risk.
Detailed description of Risk Overview dashboard cards
| Dashboard widget | Description |
|---|---|
| Total Risk Score | The combined risk score for all cloud and on-premises vulnerabilities. The range for vulnerability risk scores is 0 - 1000. The arrows indicate a change in the vulnerability risk score. |
| Total Vulnerabilities and Vulnerability Risk Over Time | Total number of vulnerabilities discovered in each environment and the resulting impact on risk score. The trend is determined by the level of risk for cloud and on-premises vulnerabilities. The percentage of risk indicates an increase or decrease in risk score in the selected time range. |
| Total Assets Over Time by Vulnerability Severity | The trend of how many assets are in cloud and on-premises environments over a selected time period, as organized by vulnerability severity. The percentage indicates a decrease or increase in assets in the time range. |
| Top 5 Vulnerabilities by Risk Score Cloud vs. On-Prem | Highest scoring vulnerabilities and the number of assets affected on Cloud and On-premises environments. |
| Vulnerabilities Actively Exploited In The Wild | The percentage of vulnerabilities actively being targeted by attackers in the real-world. This information is sourced from Rapid7 Research, CISA Kev, and 3rd Party Feeds. “Exploited in The Wild” is a cybersecurity term for malware that is actively being used by attackers (“exploited”) and can be found on devices belonging to ordinary users (“in-the-Wild”). |
| Exploitable Vulnerabilities | The percentage of vulnerabilities in cloud and on-premises environments that are at risk of exploitation. This information is sourced from and ExploitDB. “Exploitation” is a cybersecurity term for the ability to leverage an attack on a vulnerability by hackers. Read our blog for more information. |
Remediation Progress
Remediation progress data helps you evaluate the efficiency and effectiveness of the remediation activities in your security program. Depending on the effectiveness at reducing vulnerability risk, you can adjust processes to reduce the time to remediation.
Detailed description of Remediation Progress dashboard cards
| Dashboard widget | Description |
|---|---|
| Remediated Vulnerabilities | The number of vulnerabilities that are remediated. The widget also shows the percentage of vulnerabilities that have not been remediated. |
| New and Remediated Vulnerabilities vs. Vulnerability Risk Over Time | The trend of new and remediated vulnerabilities over a selected time, compared to the change in the number of backlog vulnerabilities that are remediated. The risk trend is determined by the percentage of new vulnerabilities compared to the percentage of remediated vulnerabilities, which is then compared to the percentage of change in backlog remediation. |
| Mean Time To Remediate (Cloud vs. On-Prem) | The average time from first finding the vulnerability to remediation for cloud compared to on-prem. |
| Mean Time To Remediate by Vulnerability Severity | The MTTR trend by vulnerability severity. |
Environment Trends
Understanding trends in your attack surface coverage related to the number and severity of vulnerabilities enables you to make data-driven decisions for improved cloud and on-prem asset security.
Detailed description of Environment Trend dashboard cards
| Dashboard widget | Description |
|---|---|
| Total Cloud Assets vs On-Premises assets over time | The total number of Cloud vs On-Premises assets over the specified time range. |
| Total Assets vs Vulnerability Risk Over Time | The trend in the number of assets across all environments and the impact to the overall vulnerability risk. |
| Median Asset Risk (Cloud) | The median risk score for all cloud assets. This does not include on-premises assets. The risk score range is 0 - 1000. |
| Median Asset Risk (On-prem) | The median risk score for all on-premises assets. This does not include cloud assets. The risk score range is 0 - 1000. |
Accepted Risk
For a more secure on-prem environment, understanding how much of your on-prem risk is accepted through vulnerability exceptions. Depending on the impact to your environment, you can determine whether changes are needed to the criteria for vulnerability exceptions. Support for cloud exceptions is planned.
Detailed description of Accepted Risk dashboard cards
| Dashboard widget | Description |
|---|---|
| Total Accepted Risk | Total risk score that is accepted. |
| Top 5 Exceptions by Risk Score | The on-prem assets with exceptions making the biggest reduction in risk score. |
| Total Exceptions vs Accepted Risk over time | Total number of on-prem exceptions and the resulting impact on accepted risk score over time. |
Accountability
By understanding potential gaps in asset ownership, you can determine where to assign owners to drive remediation efforts and create a more secure environment by providing accountability for asset security.
Detailed description of Accountability dashboard cards
| Dashboard widget | Description |
|---|---|
| Assets Tagged Over Time | The total number of assets tagged per environment. |
| On-Prem Assets Tagged By Criticality | Detailed view of the criticality of on-premises assets. |
| On-Prem Assets Tagged By Owner | The percentage of on-prem assets that are tagged by owner. |
| On-Prem Assets Tagged By Location | The percentage of on-prem assets that are tagged by location. |
| Cloud Assets Tagged with an Application | The percentage of cloud assets that are tagged with an application. |